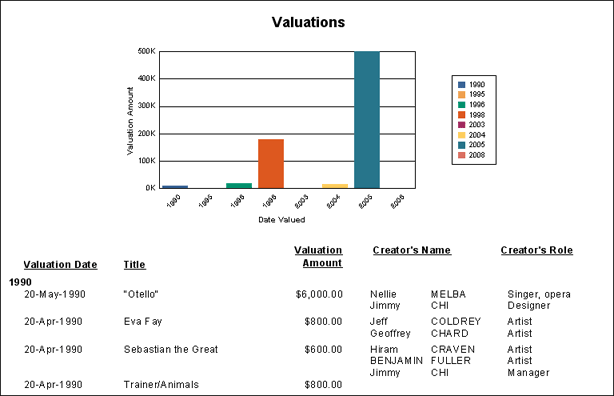
Every time a change is made to a report format in the Crystal Designer, it is necessary to save the report back to the EMu server. Until this is done, the data will be viewed in the old version of the report. Only users with the appropriate permissions may run, create, and modify reports.
The examples in this section are a continuation of How to create a Crystal report using a Blank report. We continue from the placement of fields in Design view:
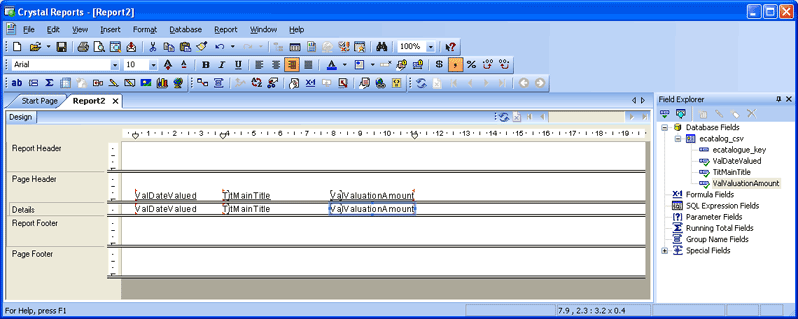
Crystal Designer screen elements include:
|
Element |
Description |
|---|---|
|
Menus |
The Menus contain the menu commands available in Windows. To operate a menu command you select a menu and then select an option from the drop list. |
|
Tabs |
Select a tab to toggle between Design view and Preview view. |
|
Report header |
Any data in the report header will display at the beginning of the report, e.g. Report title. |
|
Page header |
Any data in the page header will display at the beginning of the page, e.g. Section number. |
|
Report Details Sections |
The body of the report can be divided into sections. Each section can have different properties applied using the Section Expert. |
|
Report Footer |
Any data in the report footer will display at the end of the report, e.g. Section number. |
|
Page Footer |
Any data in the page footer will display at the end of the page, e.g. Page Number. |
Crystal Designer has a wide range of advanced formatting features. The more common features that you will use when designing a report are:
|
Feature |
Description |
|---|---|
|
Section Expert |
Used to hide, suppress, add, delete and / or format a section. To access the Section Expert, place the cursor in the grey area on the left hand side of the screen, right-click and select Section Expert. |
|
Format Editor |
Used to set attributes such as font size and style, borders and shading, paragraph formatting, suppression expressions and can grow. To access the Format Editor, select the text that you want to edit, right-click and select Font. |
|
Ruler |
Used to align objects in the report.
|
Our objective is to design a report that looks similar to:
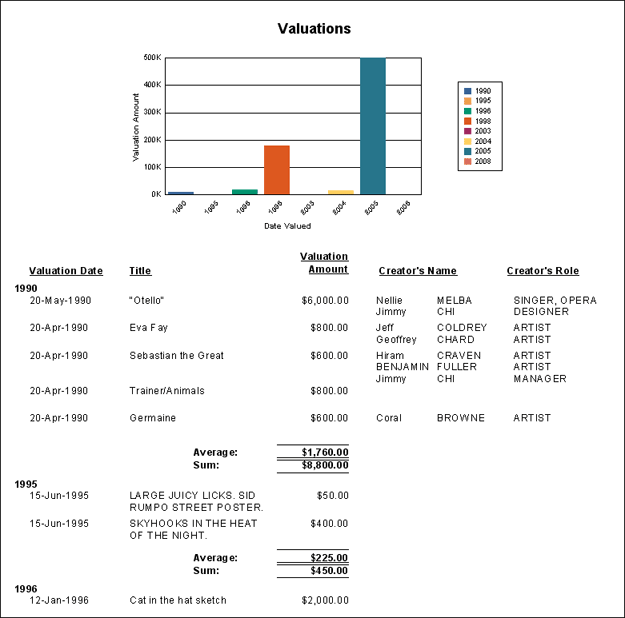
Read on for details about:
So far in this example we have added the required fields to the report:

If we preview the report (press F5), it displays as:
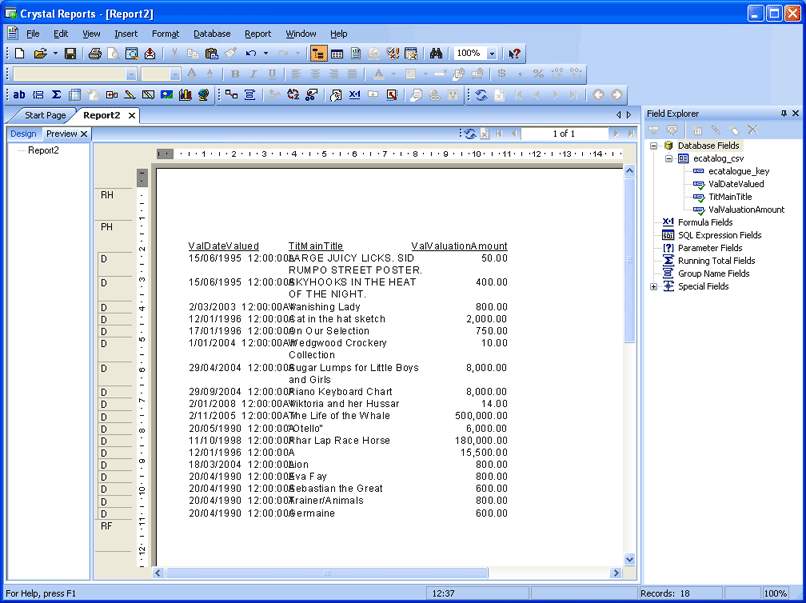
We will:
Note: Most changes in the Crystal Reports Designer can be performed on the Preview tab or the Design tab (which are accessed from the left hand side of the screen), but for this example select the Design tab as it is generally more versatile.
- In Design view, double-click a column label (ValDateValued in this example) to select it and double-click again to highlight it:

- Enter an appropriate heading and format as required using the standard Windows formatting tools (font weight, style, alignment, etc.).
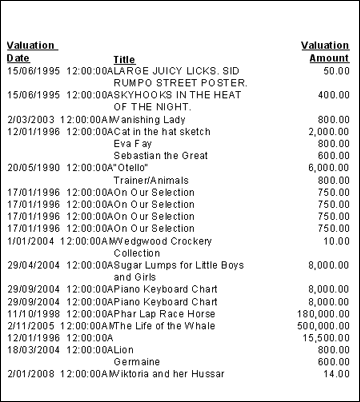
- In this example we rename and format all headings as shown in Preview view below.
- We position the headings and data as shown (use CTRL+Click to select more than one object at a time). Be sure to move a heading and its data together:
- Save the report.
- To format numbers and dates, right-click the data field (not its heading) in Design or Preview view.
In Design view, data fields are located in the Details section of the report. In Preview view, just right-click the data.
- Select Format Field from the context menu that displays.
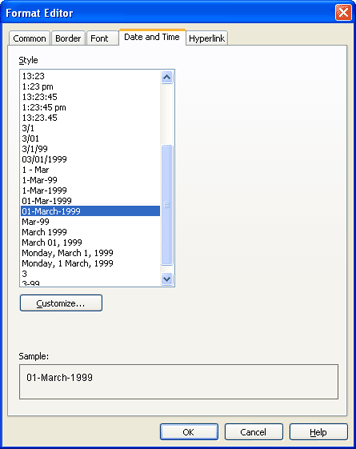
The Format Editor box displays.
- Select the required date / number format and click OK:
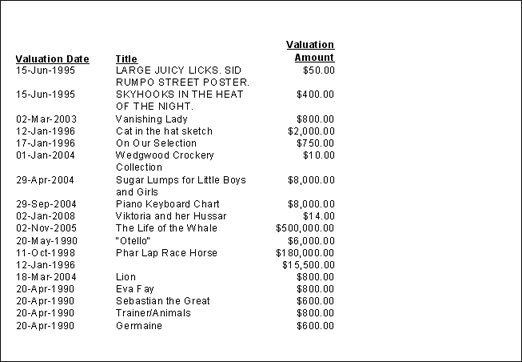
In this example the date and number fields have been formatted:
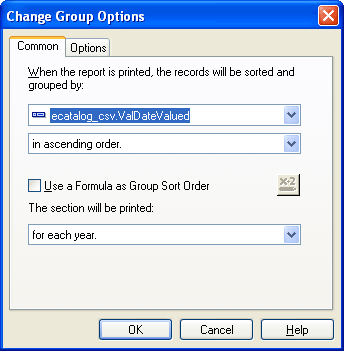
In this example we group records by year:
- In Design view, select Insert>Group from the Menu bar to display the Insert Group box.
- From the first drop list select the field on which to group records.
In this example we wish to group by Date.
- From the second drop list select the sort order for the group.
In this example we'll sort in ascending order.
- We want to group records by year (not month or week), so we select for each year from the drop list below This section will be printed:
- Click OK.
- Select the Preview tab. The records are now grouped. You may find that you need to adjust the position of headings and data:
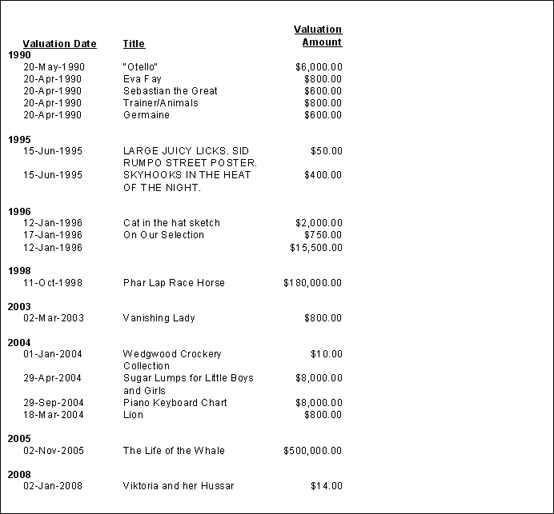
In this example we want to calculate a total (sum) for each year (using the group we created in the previous example), as well as an average:
- Select Insert>Summary from the Menu bar to display the Insert Summary box:
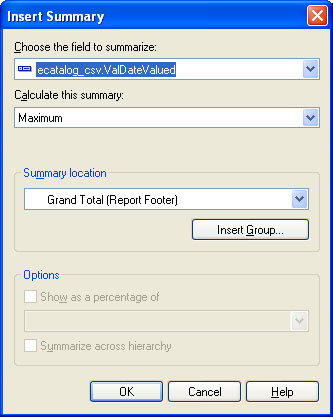
- Select the field for which a total is to be calculated from the Choose the field to summarize drop list.
In this case, Valuation Amount.
- Select a summary type from the Calculate this summary drop list to calculate any numeric values, (e.g. count for a total of records in a group or the entire report; sum to add up numeric values in a group or the entire report).
In this case, select sum.
- Select the location for the total to be displayed. The default is in the Report Footer (at the very end of the report), giving a grand total.
Note: If you have created a group, it is possible to select the group from the Summary location drop list so that the summary displays for each group, giving a sub total.
In this case we select the group we created previously (grouping by year) so that a total will be calculated for each year:
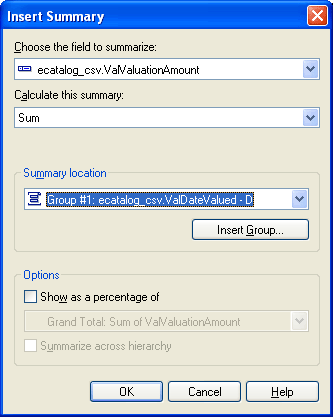
- Click OK.
The summary (unformatted and without a label) is added to the report. In Design view you will find it in a newly added Group Footer section. In Preview view, a total will be added to each year group.
- We'll also add an average for each year:
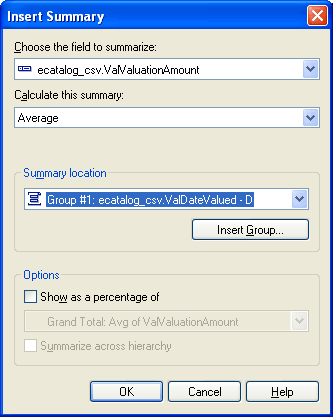
This too is added to the report - it may display on top of the previously added group, in which case it will be necessary to adjust the placement of the summaries. In this example we place the Average summary above the Total summary and format the summaries as shown in the following screenshot.
In Preview view, our report displays as:
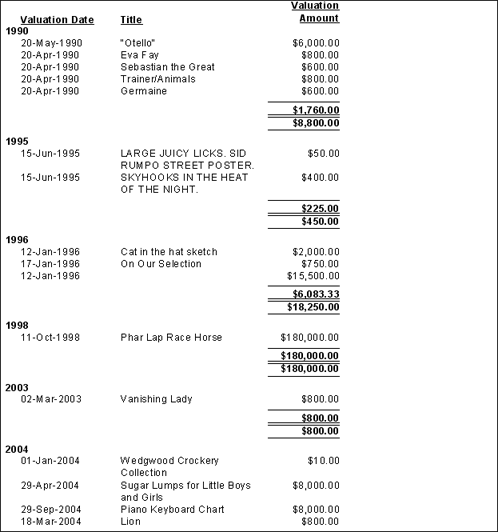
We'll next add a field label for each summary.
In the previous steps we added two summaries (a sum and average), which will display for each year. As we can see, the two summaries have no labels:

To add a label:
- In Design or Preview view, right-click the report roughly where you want the label to display and select Insert Text Object from the context menu.
The cursor will change into a cross-hair: drag out a rectangle for the label.
- Add the text, format, resize and position as required.
When we've added a label for both summaries, our report will display in Preview view as:
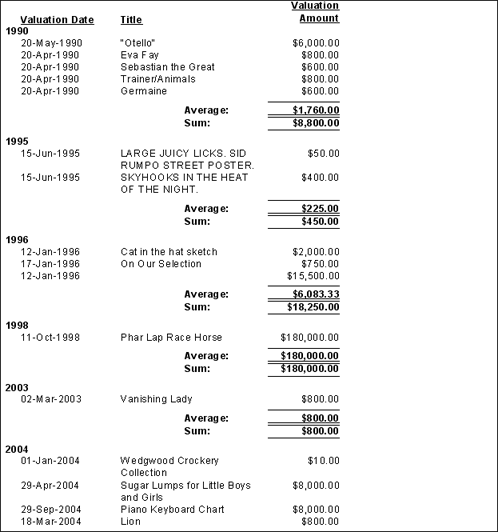
It is often quicker and easier to grasp figures when they are displayed in a graph or chart. Crystal Reports Designer allows you to insert a chart for any summary or sub-totalled field.
The Chart Expert is used to insert and modify a chart.
- In Design or Preview view click Insert Chart
 in the Tool bar
-OR-
Select Insert>Chart from the Menu bar.
- Drop the placement rectangle in the Report Header.
If a report already contains grouping and summary information, Crystal Reports Designer creates a chart without displaying the Chart Expert:
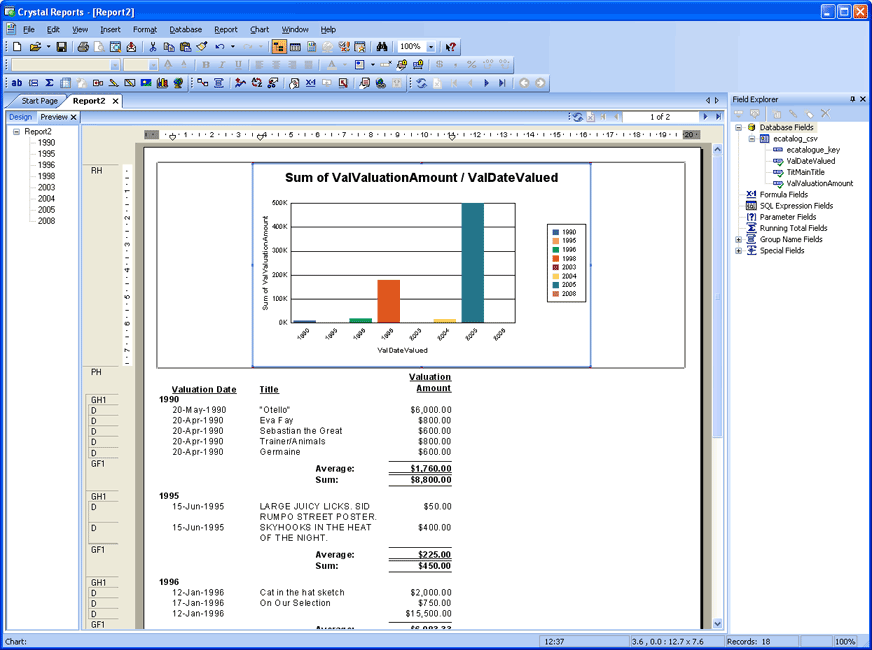
- To edit the chart, right-click it and select Chart Expert from the context menu that displays.
The Chart Expert box displays:
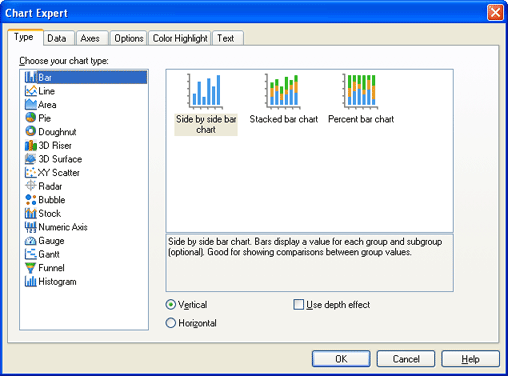
In this example we will place a tick in the Use depth effect checkbox (see below for the result).
- Edit the chart as required.
- Select the Type tab and from the Chart type list, select the type of graph to use, e.g. Bar.
- Select the Data tab and select the data that is to be graphed:
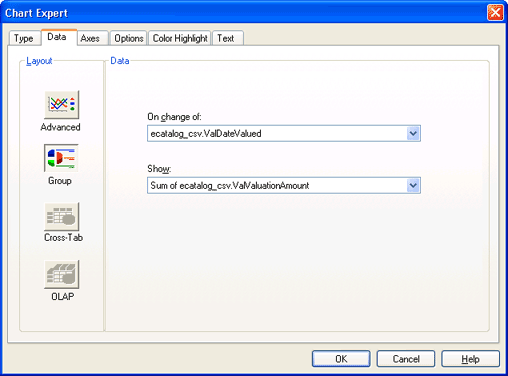
If a report already contains grouping and summary information, Crystal Reports Designer uses this information by default. You would select alternate data from the drop lists or select the Advanced button in the left hand column to configure the Chart data from scratch.
The On change of option specifies the group field to use as a condition for plotting values in a graph or chart. Points will be plotted whenever the value in the group changes. It is possible to choose from groups created on the Grouping screen. In this example there is only one group and it is selected automatically.
- Select the Text tab and add the required titles and specify the font for each:
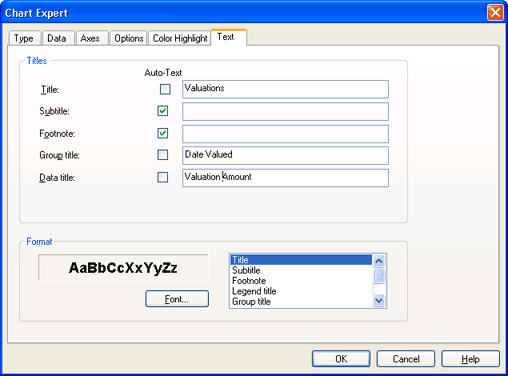
- Click OK.
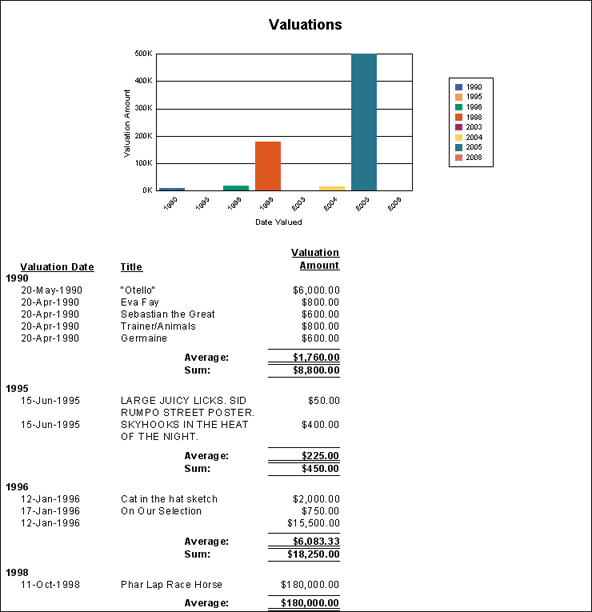
If we preview the report, it now displays as:
A formula can be added to manipulate the data within your report. Formulas can be used to:
- Calculate percentages
- Concatenate fields
- Compare dates
- Remove spaces
- Check the length of a field
In this example the text value in a field is converted to UPPERCASE.
- In the Field Explorer pane, right-click Formula Fields and select New from the drop list:
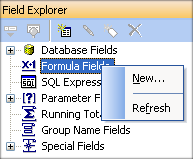
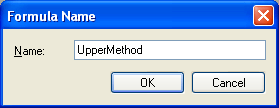
The Formula Name box displays.
- Enter a descriptive name for the formula and click OK:
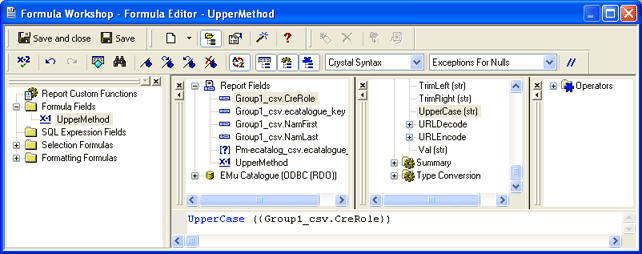
The Formula Editor displays:
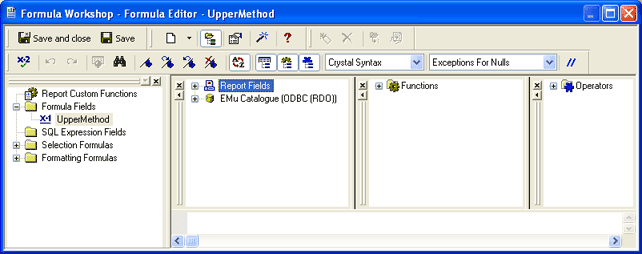
- In the middle pane, double-click Functions to expand it and then expand Strings:
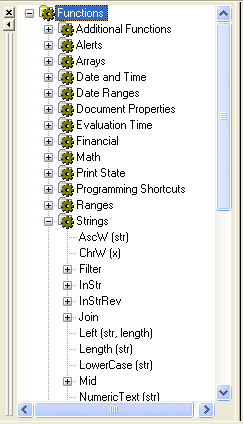
- Scroll through the list of Strings functions and double-click UpperCase(str).
UpperCase()is inserted into the Formula pane: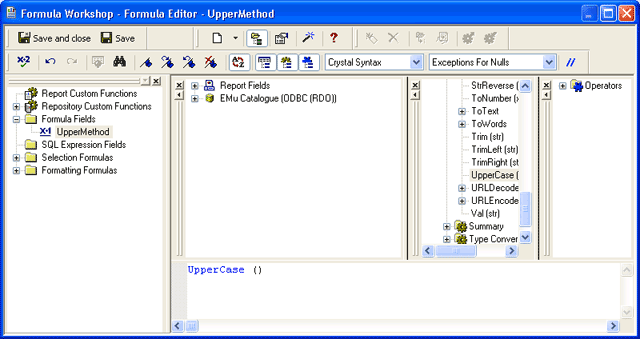
Note: Make sure that the cursor is blinking between the two brackets after the word UpperCase.
- Expand and scroll through the Report Fields list and double-click the name of the field to be displayed in upper which the formula is to be applied.
The field name will be inserted between the brackets of the formula:
- Click Check Errors
 in the Tool bar to check for errors in the formula.
 - Click Save and Close.
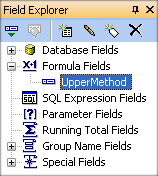
The Fields Explorer displays the new formula:
- To insert the formula into your report, select the formula name (
UpperMethodin this example) and drag it to the report.If required, move and / or delete fields. For instance, if your report included a surname field and you've created a formula to convert the surname field to upper case, simply replace the surname field with the UpperMethod field.
If we preview the report, it now displays as:
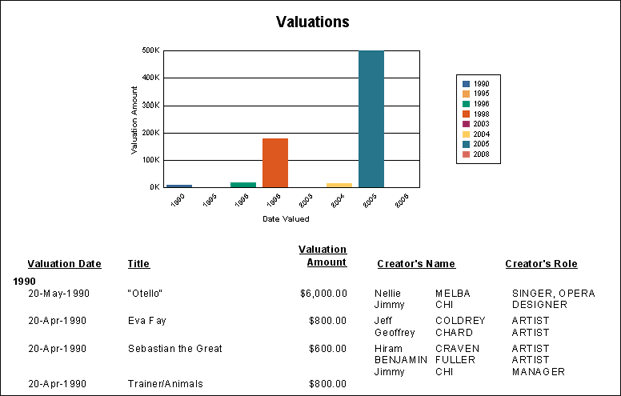
When you replace a field with a formula it may be necessary to add a new column heading and align headings.
Note: Click Help to access Crystal's Online help for details about how to use the Formula Editor.
- If the headings need to be aligned horizontally:
- Position a heading correctly and click it (or simply click a heading that is positioned correctly).
- Press the
CTRLkey on the keyboard and then click the other headings.
- Right-click the correctly positioned heading.
From the context menu that displays, select how to align the headings, e.g. Align>Bottoms:
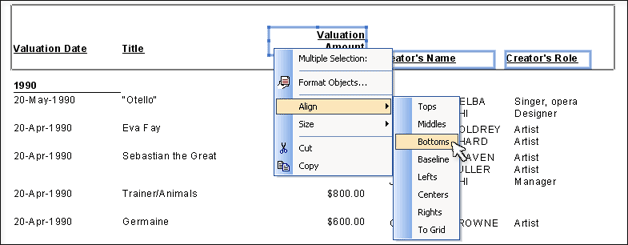
The headings align correctly:

Note: If your system is running Windows 11, be sure to read the note at the end of Step 7.
The steps for creating a report in EMu are outlined in 1: Create the report in EMu. In this example, the only difference is that we add a multimedia field to the report (Steps 1-3):
- Add the required multimedia field(s) to the Fields tab of the Report Properties box:
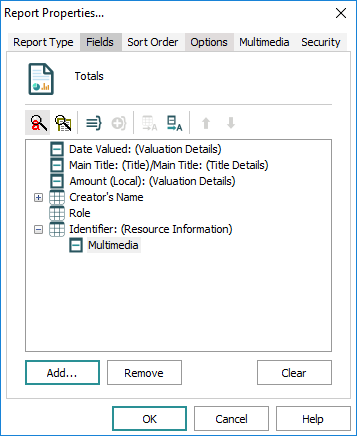
Note: If you include multimedia from different modules in the report, and the parent folders share the same name (Identifier: (Resource Information)) in the screenshot above), they must be renamed so that they are different from each other. The Multimedia fields themselves MUST NOT be renamed. In the example above, if you were including multimedia from two different modules and both parent folders were called Identifier: (Resource Information), you would rename one of them (by clicking the field and typing a new name), but you would not change the Multimedia field for either of them.
When a multimedia field is added to the report, the Multimedia tab is added to the Report Properties box.
- Select the Multimedia tab:
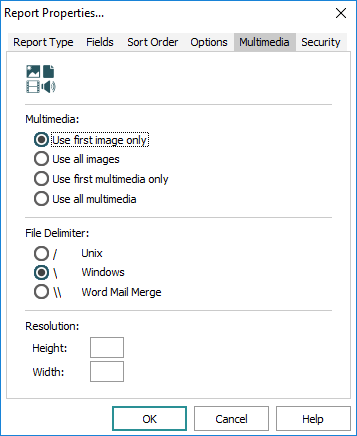
 Multimedia tab options
Multimedia
Description
Use first image only
If there are multiple images in the record, only the first will display in the report.
Note: If you include other multimedia fields, such as Creation Date, this detail will display in the report for all images, not just for the first image.
Use all images
All images in the record will display in the report.
Note: PDFs are treated as images and may be included in your report as an image if either Use first image only or Use all images is selected. If necessary, it is possible to filter out PDFs in Crystal Reports.
Use first multimedia only
Only the first multimedia resource will be referenced in the report.
Note: If you include other multimedia fields, such as Creation Date, this detail will display in the report for all images, not just for the first image.
Use all multimedia
All multimedia resources in the record will be referenced in the report.
Note: Select Use first / all multimedia to reference any multimedia available (images, audio, video, etc.). Select Use first / all images to display images (and an image of one or more PDFs) only.
File Delimiter
Description
\
Defaults to Windows.
Resolution
Description
Height / Width
Specify the desired resolution of images to display in the report, e.g. 200 x 200.
Each image in EMu can have multiple resolutions. When a resolution is specified here, the version of an image closest in size (equal to or greater than the resolution specified) will be displayed.
If no resolution is specified, the master image is displayed (the first image listed in the Resolutions table on the Resolutions tab of the Multimedia module).
Tip: If the fields are blank and you can't seem to enter numbers, double-click the field - this will select everything in the field (including spaces). Try entering the number again.
- Add a height and width as shown:
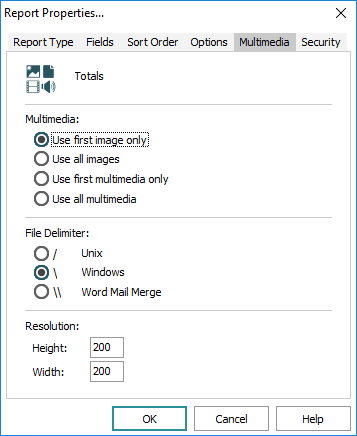
Tip: If the fields are blank and you can't seem to enter numbers, double-click the field - this will select everything in the field (including spaces). Try entering the number again.
- When you have finished configuring the report in EMu, run it.
- In Crystal Reports Designer, we need to drag the Multimedia field to the report.
Generally you would add a new field to the Details section of the report. In this case we're adding a multimedia field, and in order that it displays without overlapping other data in the Details section of the report, we'll place it in a new section.
- Right-click the Details section of the report (which is located in the the left hand column of the Crystal Reports Designer in Design view).
- Select Insert Section Below from the context menu that displays.
A new section, Details b, is added:

 Important if your system is running Windows 11
It appears that it is no longer possible to insert a Paintbrush Picture as an OLE Object, as described in Steps 8-14. The following workaround can be used in place of Steps 8-14:
- In the Insert menu, select Picture.
- Add an image to the report (it does not matter what this image is as it is just a place-holder that will be replaced with images from the EMu database).
- Right-click the image and choose Format Graphic.
The Format Editor dialogue will open.
- On the Picture tab, select the Formula
 icon.
icon.The Formula Workshop dialogue will open.
- Expand Report fields and double-click Multimedia.
- Click Save and close and close the Format Editor dialogue.
- Continue with Step 15 below.
- Resize the new section and drag the Multimedia field to it:
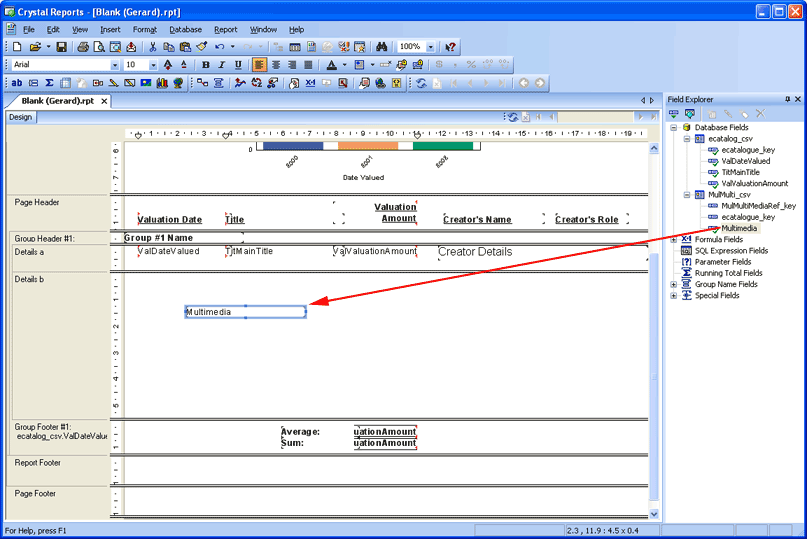
- The Multimedia field you have added to the report is a string that holds the pathway to an image. In order to hide the pathway when viewing the report, right-click the Multimedia field.
- Select Format Field from the context menu that displays.
The Format Editor box displays.
- On the Common tab of the Format Editor box, make sure the Suppress box has a tick in it.
- Click OK to close the Format Editor box.
- Select Insert>OLE Object from the Menu bar to display the Insert Object box:
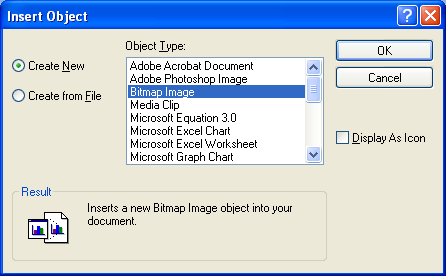
Note: Depending on your version of Windows, Bitmap Image may not be listed in the Insert Object dialogue box. If it is not (typically in versions of Windows after Windows XP), select Paintbrush Picture instead.
- Select the object type, Bitmap Image in this example, and then click OK.
An image control box displays at your cursor. Click the report immediately to the left of the Multimedia field:
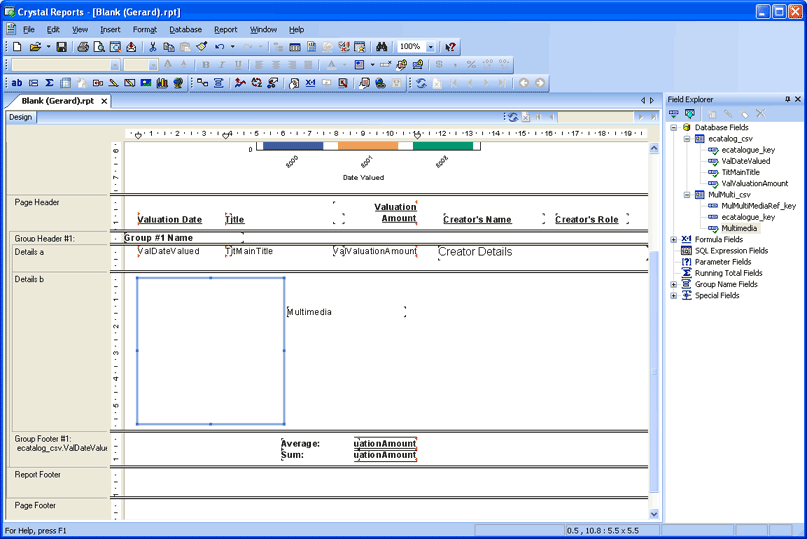
Note: The Image Control box must be placed to the left of the Multimedia field. Any number of image controls can be added to a report. Each control will be associated with the Multimedia field closest to which it is positioned.
Note: Images do not display in the preview mode of Crystal Reports Designer.
- To add a border to the graphic, right-click the image control.
- Select Format Graphic from the context menu that displays.
The Format Editor box displays.
- On the Border tab of the Format Editor box, select the border to display:
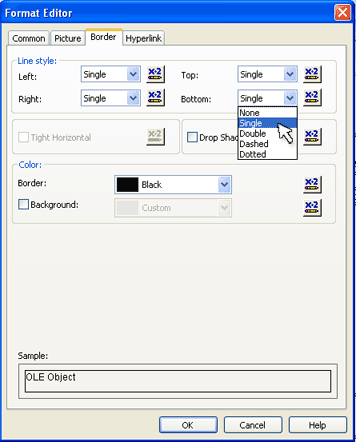
Note: The location of an image within the image control is determined by the selection of borders. If borders have been selected, the image will be centred in the control; if borders are not selected, the image will be positioned in the top-left corner of the control.
- Click OK to close the Format Editor box.
- Save the report.
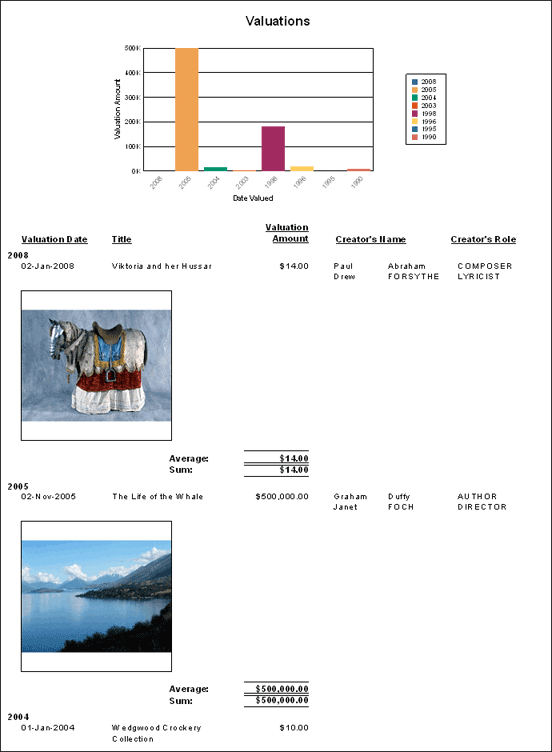
When the report is run, multimedia will be included:
The subreport in this example is added to the following report:
Note: See How to create a Crystal report using a Blank report for details about the design of the report to this point.

- With the main report open in Crystal Designer, select the Design tab.
- Select Insert>Subreport from the Menu bar
-OR-
Click Insert Subreport
 in the Insert Tools Tool bar.
The Insert Subreport box displays:
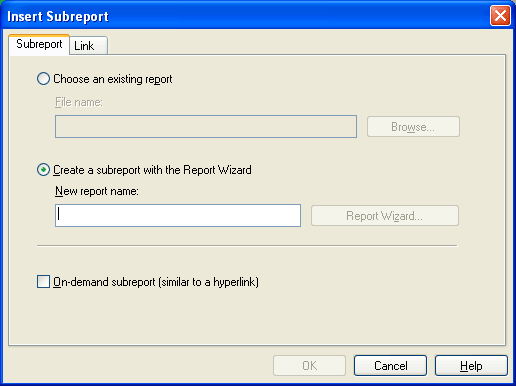
- Either select the Choose an existing report radio button and browse to an existing report (proceed to Step 8)
-OR-
Select the Create a Subreport with the Report Wizard radio button.
- Enter a meaningful name for the subreport in the New report name field.
The Report Wizard button becomes active.
- Click Report Wizard.
The Standard Report Creation Wizard displays:
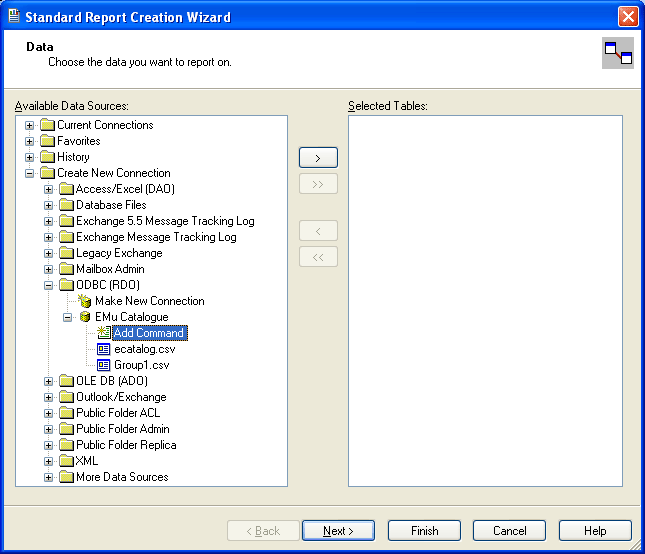
- Select the table that contains the data for the subreport, Group1.csv in this example, and move it to the Selected Tables list:
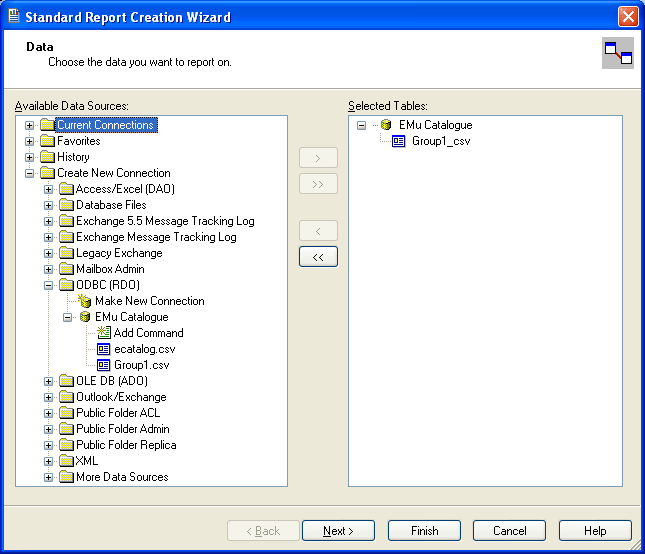
- Click Next to continue.
The Fields screen displays.
- Add the required fields to the Fields to Display list:
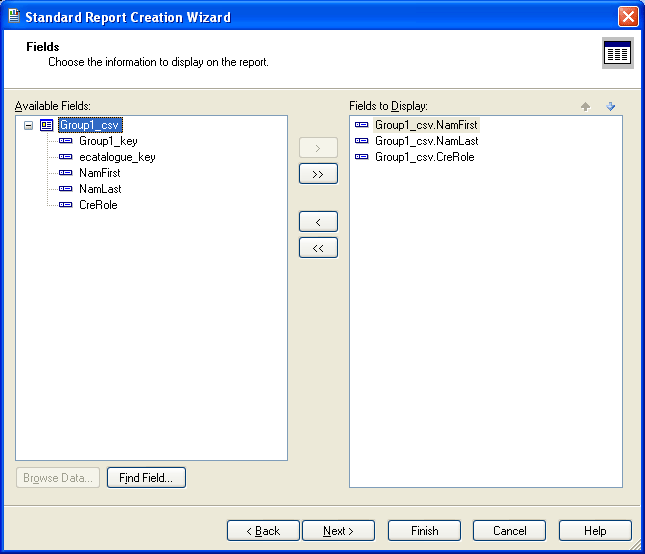
- Click Next to perform grouping, adding summaries, sorting, etc.
-OR-
Click Finish to end the Wizard.
- It is necessary to specify the key field that links records in the tables in the main report and the subreport.
Note: If necessary, open the .csv files in order to identify the linking field.
Select the Link tab in the Insert Subreport dialogue box:
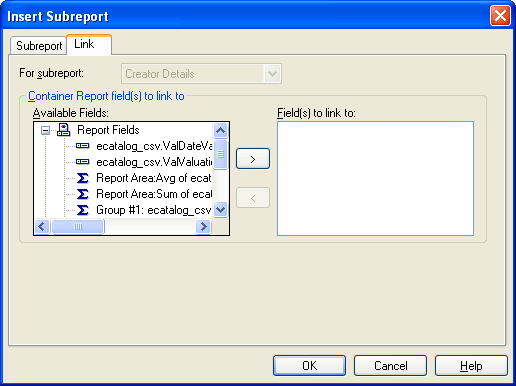
- Scroll through the Available Fields list and in the main .csv table double-click the linking key field, moving it to the Field(s) to link to list:
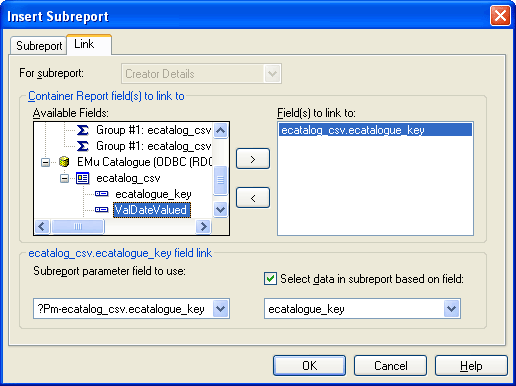
- Click OK in the Insert Subreport dialogue box.
An orange box displays at the cursor.
- Click the Details section of the report where you would like the subreport to display:
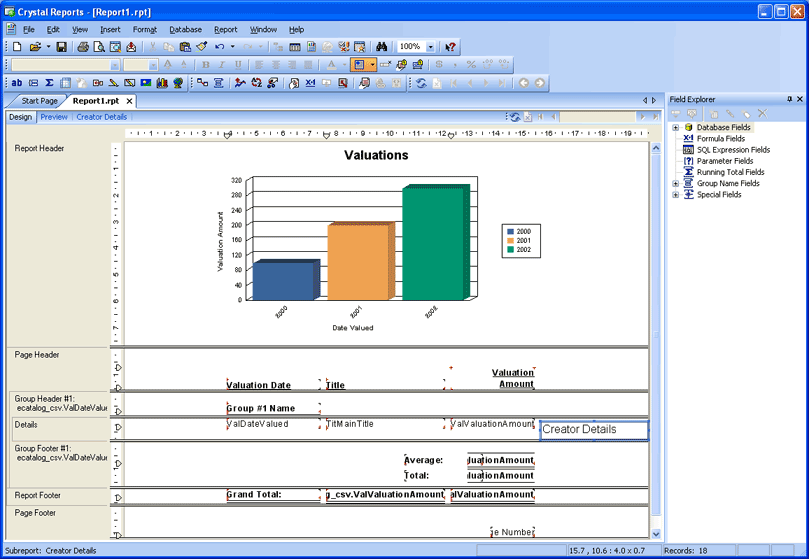
- Double click the subreport object.
The subreport displays in its own Design view:
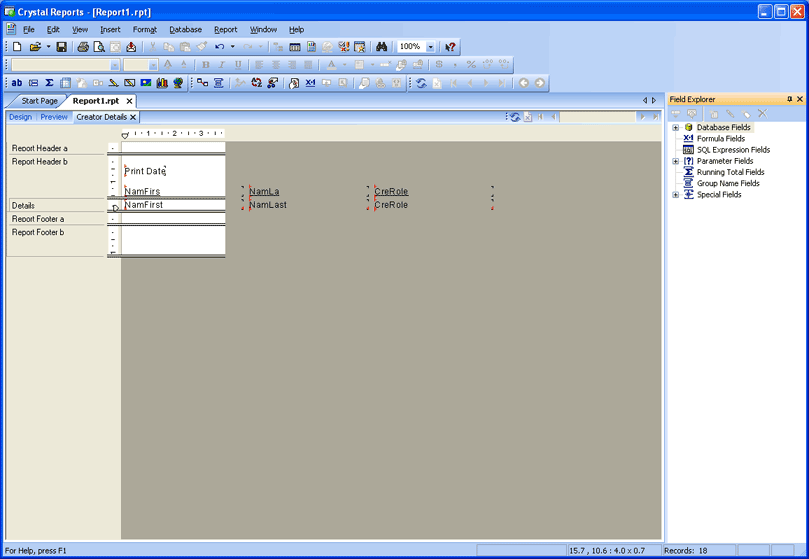
- In this example we only require the Details section of this subreport, so we'll suppress everything else (Report Header a, Report Header b, Report Footer a and Report Footer b):
- Right-click a section label (e.g. Report Header a).
- Select Suppress (No Drill-Down) from the context menu that displays.
- Select the Preview tab:
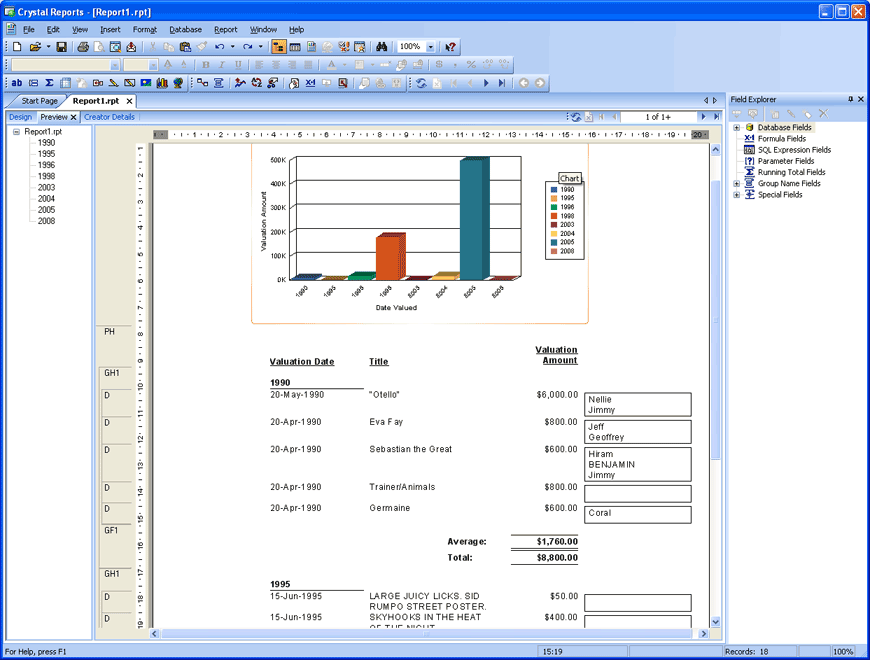
In this example, not all the fields in the subreport display.
- There are a number of things you may need to do to have all fields display:
- In the subreport, you may need to move the fields closer together.
- In Design view you may need to increase the width of the subreport object.
- In Design view you may need to adjust the position of all fields in order to fit all the data on the report.
- In the subreport, format the data as required (e.g. format dates, number values, etc.).
- To remove or change the border from the subreport:
- Right-clicking the subreport object in Design view.
- Select Format Subreport from the context menu that displays.
- Select the Border tab and make changes as required.
Add headings for the new fields to the Page Header section of the report, align and format them to match the other headings:
